The evidence platform for universities.

Your curriculum,against the live labour market.

Programme by programme. With evidence.

uni.erda.work · platform preview
uni.erda.work
Platform home dashboard, showing three views (Labour market, Study programmes, Student analytics) and recently viewed programmes
/ 01

Three answers

Where your curriculum stands, what the labour market demands, and where each student fits — measured on a shared taxonomy.

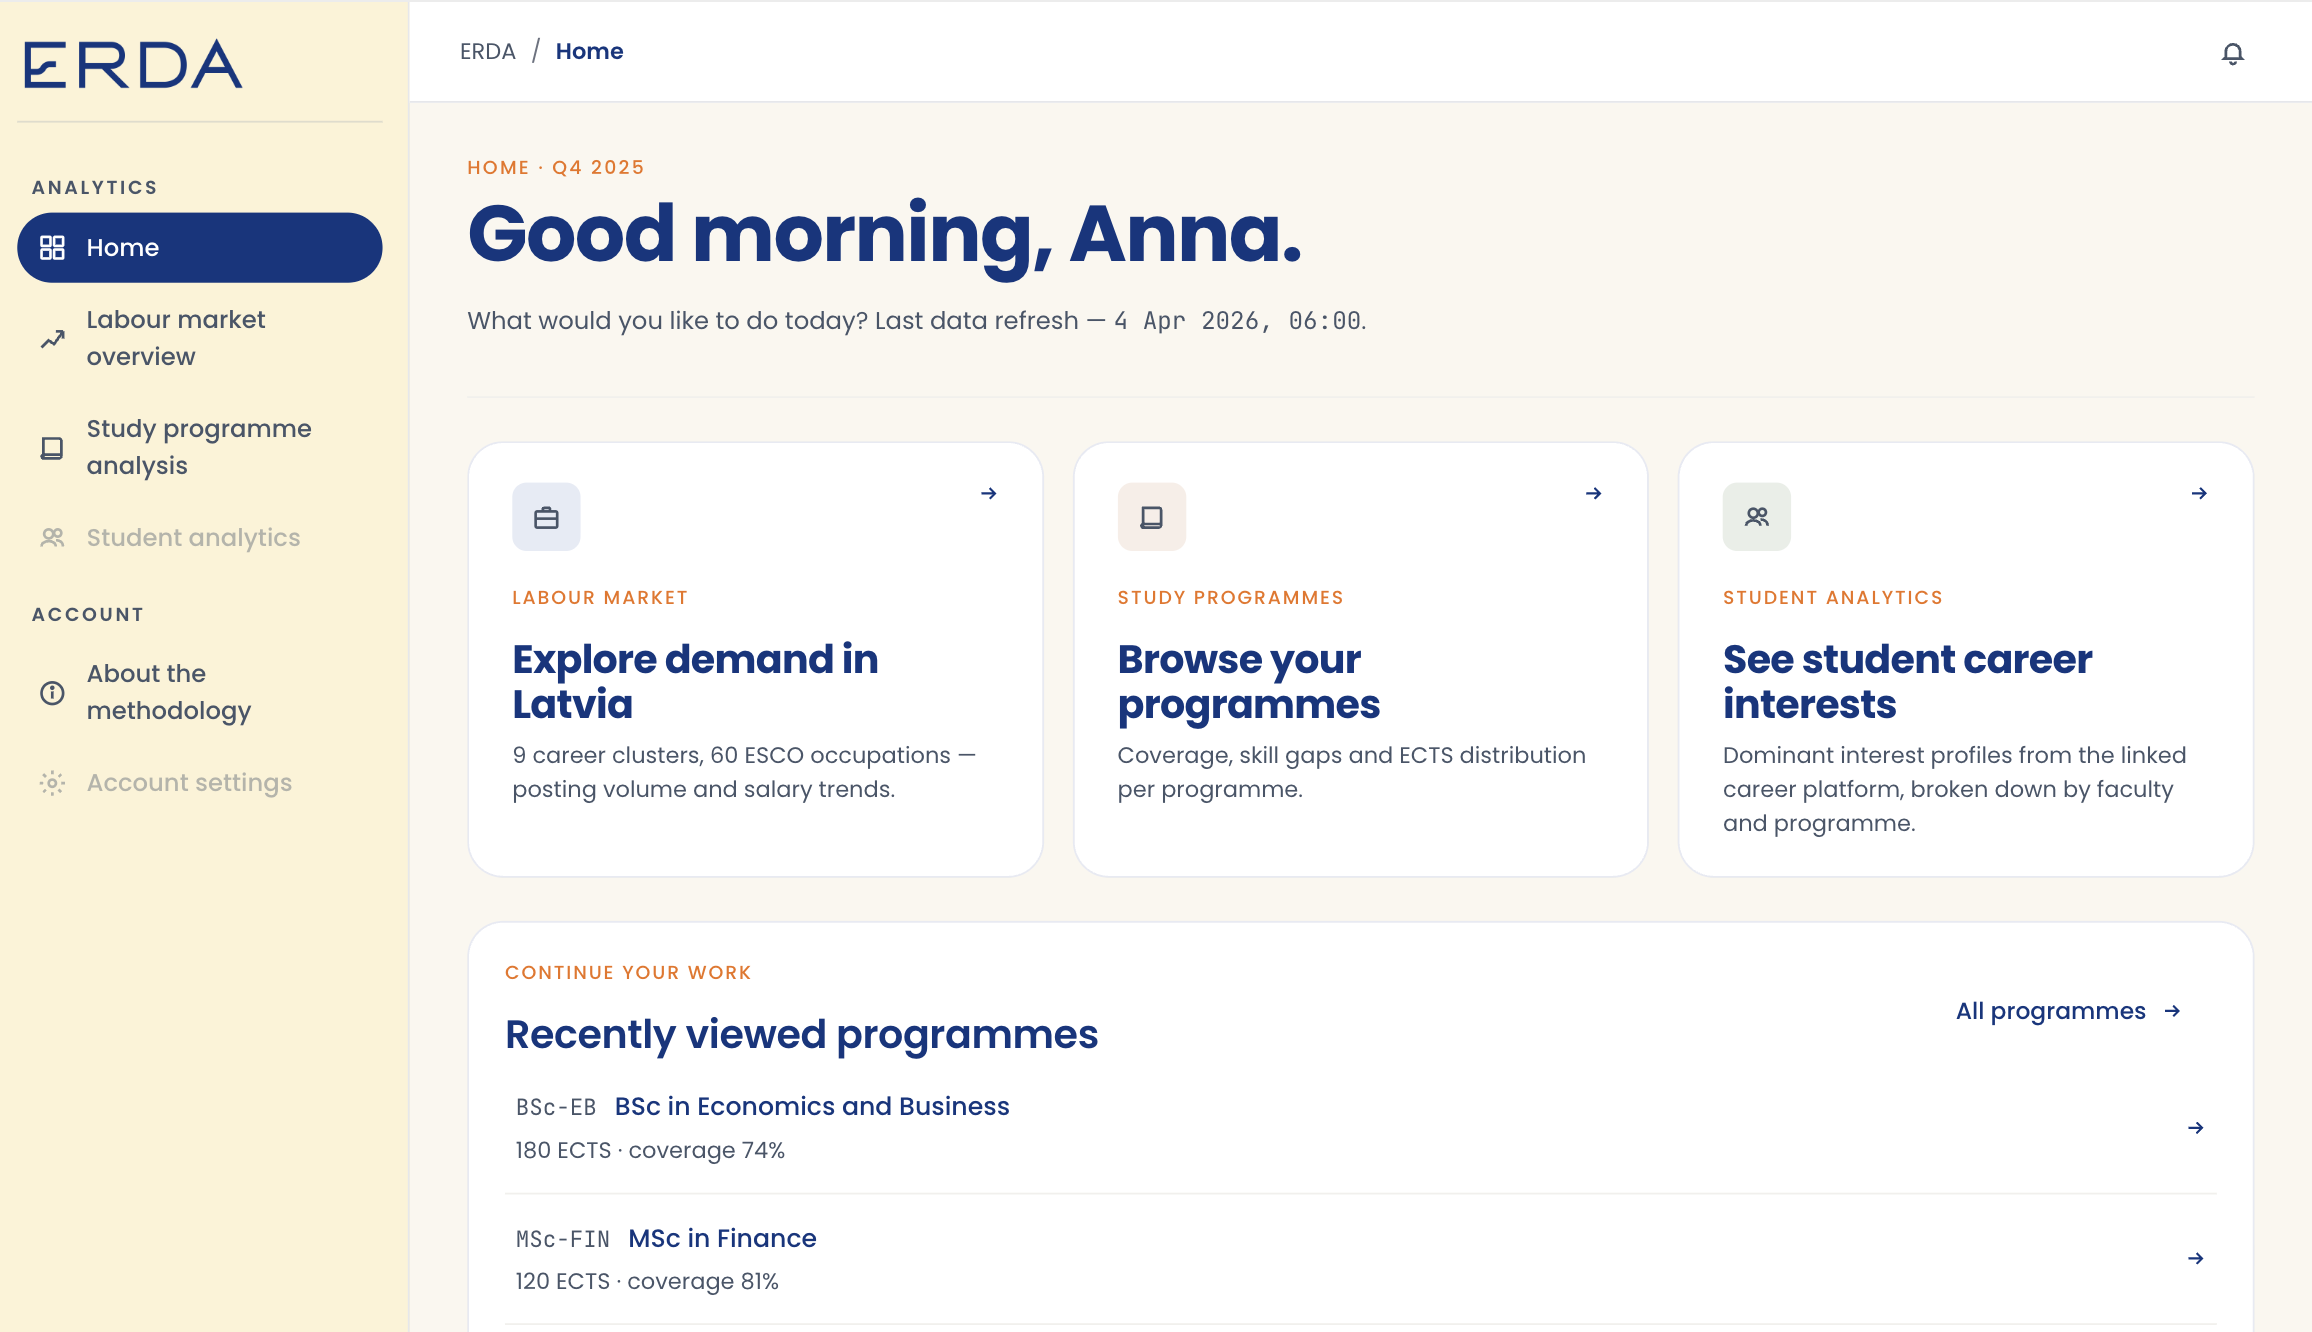
View 01 · Curriculum

For deans, vice-rectors for studies, and accreditation teams.

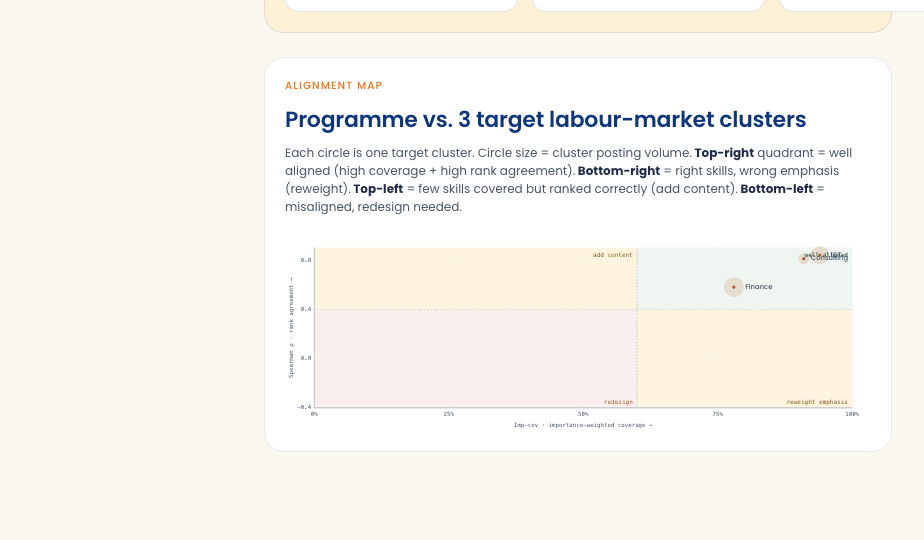
Where each programme stands against its target clusters.

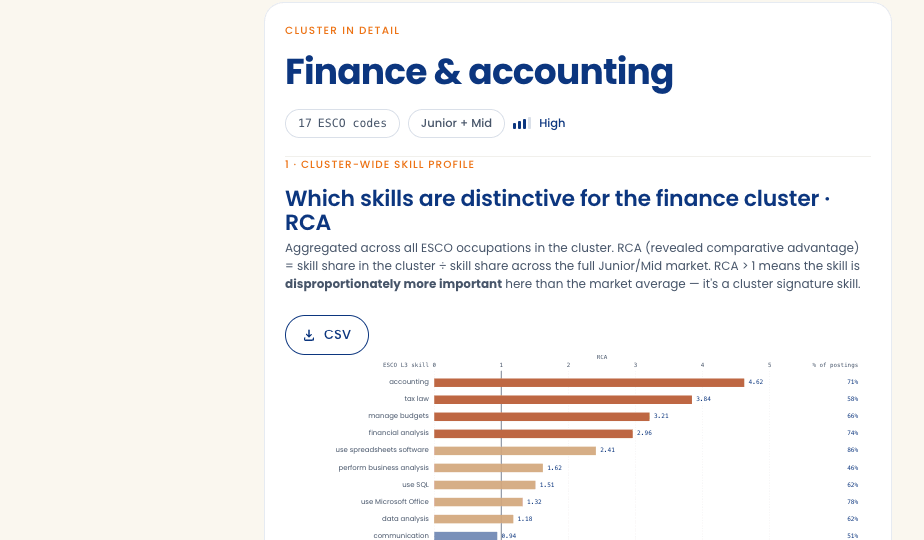
Every programme mapped to live labour-market demand, course by course. The alignment map plots programmes against their target clusters — quadrants tell you whether to redesign, reweight, or add content. Evidence you can defend in accreditation.

uni.erda.work · BSc economics & business · alignment map
Alignment map: scatter plot of programmes against three target labour-market clusters, with quadrants for redesign, reweight, add content, and well-aligned
View 02 · Labour market

For everyone in the institution.

Where the demand is — volume, pay, and skill signature.

The regional labour market, organised into the clusters that matter to your university. Posting volumes, salary ranges, and the skill signatures employers ask for — at occupation-level granularity.

uni.erda.work · labour market · finance & accounting
RCA-based skill profile for Finance & accounting cluster, ranked horizontal bar chart with accounting, tax law, manage budgets, financial analysis as the top distinctive skills
View 03 · Students

For career centres.

Where each student's interests meet real demand.

A Holland code (RIASEC) test matches each student to the occupations where they're likely to thrive — with the live labour-market reality for each role: posting volume, salary ranges, the skills employers are asking for. Built on the same ESCO foundation as the rest of the platform.

uni.erda.work · students · profile
Student profile · BSc, year 2
IASREC
Holland code IAS · Investigative · Artistic · Social
Matched ESCO occupations · 12-mo demand
  • Market research analyst▲ 12%
  • UX / UI designer▲ 8%
  • Data journalist▲ 4%
  • Communications specialist▼ 1%
/ 02

How the analysis happens

Three live sources — your course outlines, live job postings, and the ESCO taxonomy — feed every number on the platform. Here's how they become evidence.

  1. 01

    Course outlines arrive.

    Universities send programme curricula and course learning outcomes. No system access needed.

  2. 02

    Career clusters agreed.

    Together we define the occupational clusters that matter — the roles you actually want your graduates to compete for.

  3. 03

    Mapped via ESCO.

    Each course is mapped to ESCO skills and occupations — the same vocabulary the labour-market data is already organised around.

  4. 04

    Analysis runs.

    RCA-based alignment scoring, importance-weighted coverage, rank-shift detection, and bootstrap confidence intervals.

  5. 05

    Results presented.

    Programme-by-programme evidence, in the platform and on a PDF you can take into a faculty meeting. Continuously refreshable thereafter.

/ 03

Methodology

Two skill profiles — one for the labour market, one for your curriculum — built on the same taxonomy and compared with confidence intervals.

For each programme, we build a labour-market skill profile from tens of thousands of live job postings, and a curriculum skill profile from your course-level learning outcomes. Both are expressed in ESCO L3 — Europe's standard skill vocabulary — so they can be put side by side. The gap between them, with statistical uncertainty quantified, is what drives every recommendation.

Step 01 · Labour market

From job ads to a skill profile per career cluster.

We pool job postings into career clusters — coherent groups of ESCO occupations that represent realistic graduate destinations. For each cluster we identify the skills employers distinctively ask for, not just the skills that appear most often.

Step 02 · Curriculum

From course outlines to a programme-level skill profile.

Each course is mapped to ESCO skills via its learning outcomes, then aggregated to the programme. Weights reflect how students actually experience the programme — ECTS credits, and where relevant, student-share for optional tracks.

Step 03 · Comparison

From two profiles to an alignment diagnosis.

Three complementary metrics — weighted mean gap, importance-weighted coverage, and rank correlation — score each programme against each cluster. Together they show where the curriculum is light, where it is heavy, and whether the emphasis is in the right order.

Techniques · in detail

Methods and metrics, in detail.

  1. 01ESCO L3 shared vocabularyEurope's official Skills, Competences and Occupations taxonomy at its third hierarchical level (~3,000 skills, ~3,000 occupations). Used on both sides of the comparison, so curriculum and labour-market evidence are commensurable by construction.
  2. 02Career clustersGranular ESCO occupations grouped into coherent career paths a programme's graduates could realistically pursue. Clusters are not predefined — they are configured per programme during onboarding, in a workshop with the university, so they reflect the destinations this faculty actually wants its graduates to compete for. They then form the unit of comparison for every metric below.
  3. 03RCA Revealed Comparative AdvantagePer-skill, per-job-ad RCA computed across the full Junior/Mid market, then averaged within each cluster — following Dawson, Williams & Rizoiu (2020), Eq. 3. This surfaces the skills distinctive to a cluster relative to the wider labour market, not the skills that are simply frequent everywhere.
  4. 04ECTS-weighted curriculum aggregationProgramme-level skill importance is the credit-weighted sum of course-level skills, modelled in layers — core, specialisation tracks, electives — so the analysis reflects how a real cohort moves through the programme, not just the catalogue.
  5. 05Frequency floorsTwo filters keep estimates stable: a skill must appear in ≥ 5 ads market-wide (so the RCA denominator is well-defined), and ≥ 5 ads within a cluster (so cluster-level importance isn't driven by a handful of postings).
  6. 06Metric 1 · Weighted mean gapWhat it is. A single-number summary of how well a programme matches a cluster's demand.How it is calculated. For each demanded skill we compute the gap (cluster demand − curriculum provision, both max-normalised within the cluster's skill set), then take the average weighted by the cluster's importance for that skill.What it tells you. A large positive value means the programme is systematically under-providing what the cluster most needs; close to zero means the emphasis is broadly balanced against this destination.
  7. 07Metric 2 · Importance-weighted coverageWhat it is. The share of the cluster's demand the programme touches at all.How it is calculated. Sum of cluster importances over skills the curriculum actually teaches, divided by sum of cluster importances over all demanded skills — a value between 0 and 1.What it tells you. High coverage means the programme at least mentions most of what matters for this destination; low coverage points to whole skill areas the programme doesn't address, and is the strongest signal that new content is needed.
  8. 08Metric 3 · Spearman ρ rank correlationWhat it is. Whether the curriculum and the cluster put the same skills at the top.How it is calculated. Both sides are ranked across the cluster's demanded skills; Spearman's ρ is the rank correlation between those two rankings.What it tells you. High ρ means emphasis is in the right order even if absolute levels differ; low or negative ρ means the programme teaches the demanded skills, but with the wrong relative weight — a signal to reweight existing courses rather than add new ones.

Pilot programme

The pilot is open.

Three pilot partner universities. Co-developed methodology, preferential terms, direct access to the team. We start when you're ready.